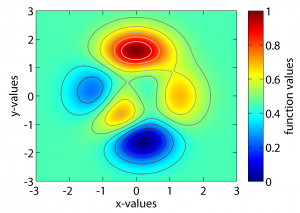
contour with gray colormap using combined colormap
A trivial solution to have two colormaps is to combine two colormaps in one and adjust the data such, that the right part of the colormap is used for each plot.
hold on; % create a combined colormap caxis([-1 1]); colormap([gray(colorDepth); jet(colorDepth)]); hplot = pcolor(x,y,data); shading flat % plot contour with shifted dataset (lower colormap) [C,hfigc] = contour(x, y, data-1,[-1:0.1:0]); set(hfigc, 'LineWidth',1.0); hold off; hcb = colorbar('location','EastOutside', ... 'FontSize' , FontSize , ... 'FontName' , FontName , ... 'Ylim' , [0 1] , ... 'Box' , 'on' , ... 'TickDir' , 'in' , ... 'TickLength' , [.02 .02] , ... 'LineWidth' , 0.6); hcLabel = ylabel(hcb,zLabelText); set([hcLabel], ... 'FontSize' , FontSize , ... 'FontName' , FontName); |

