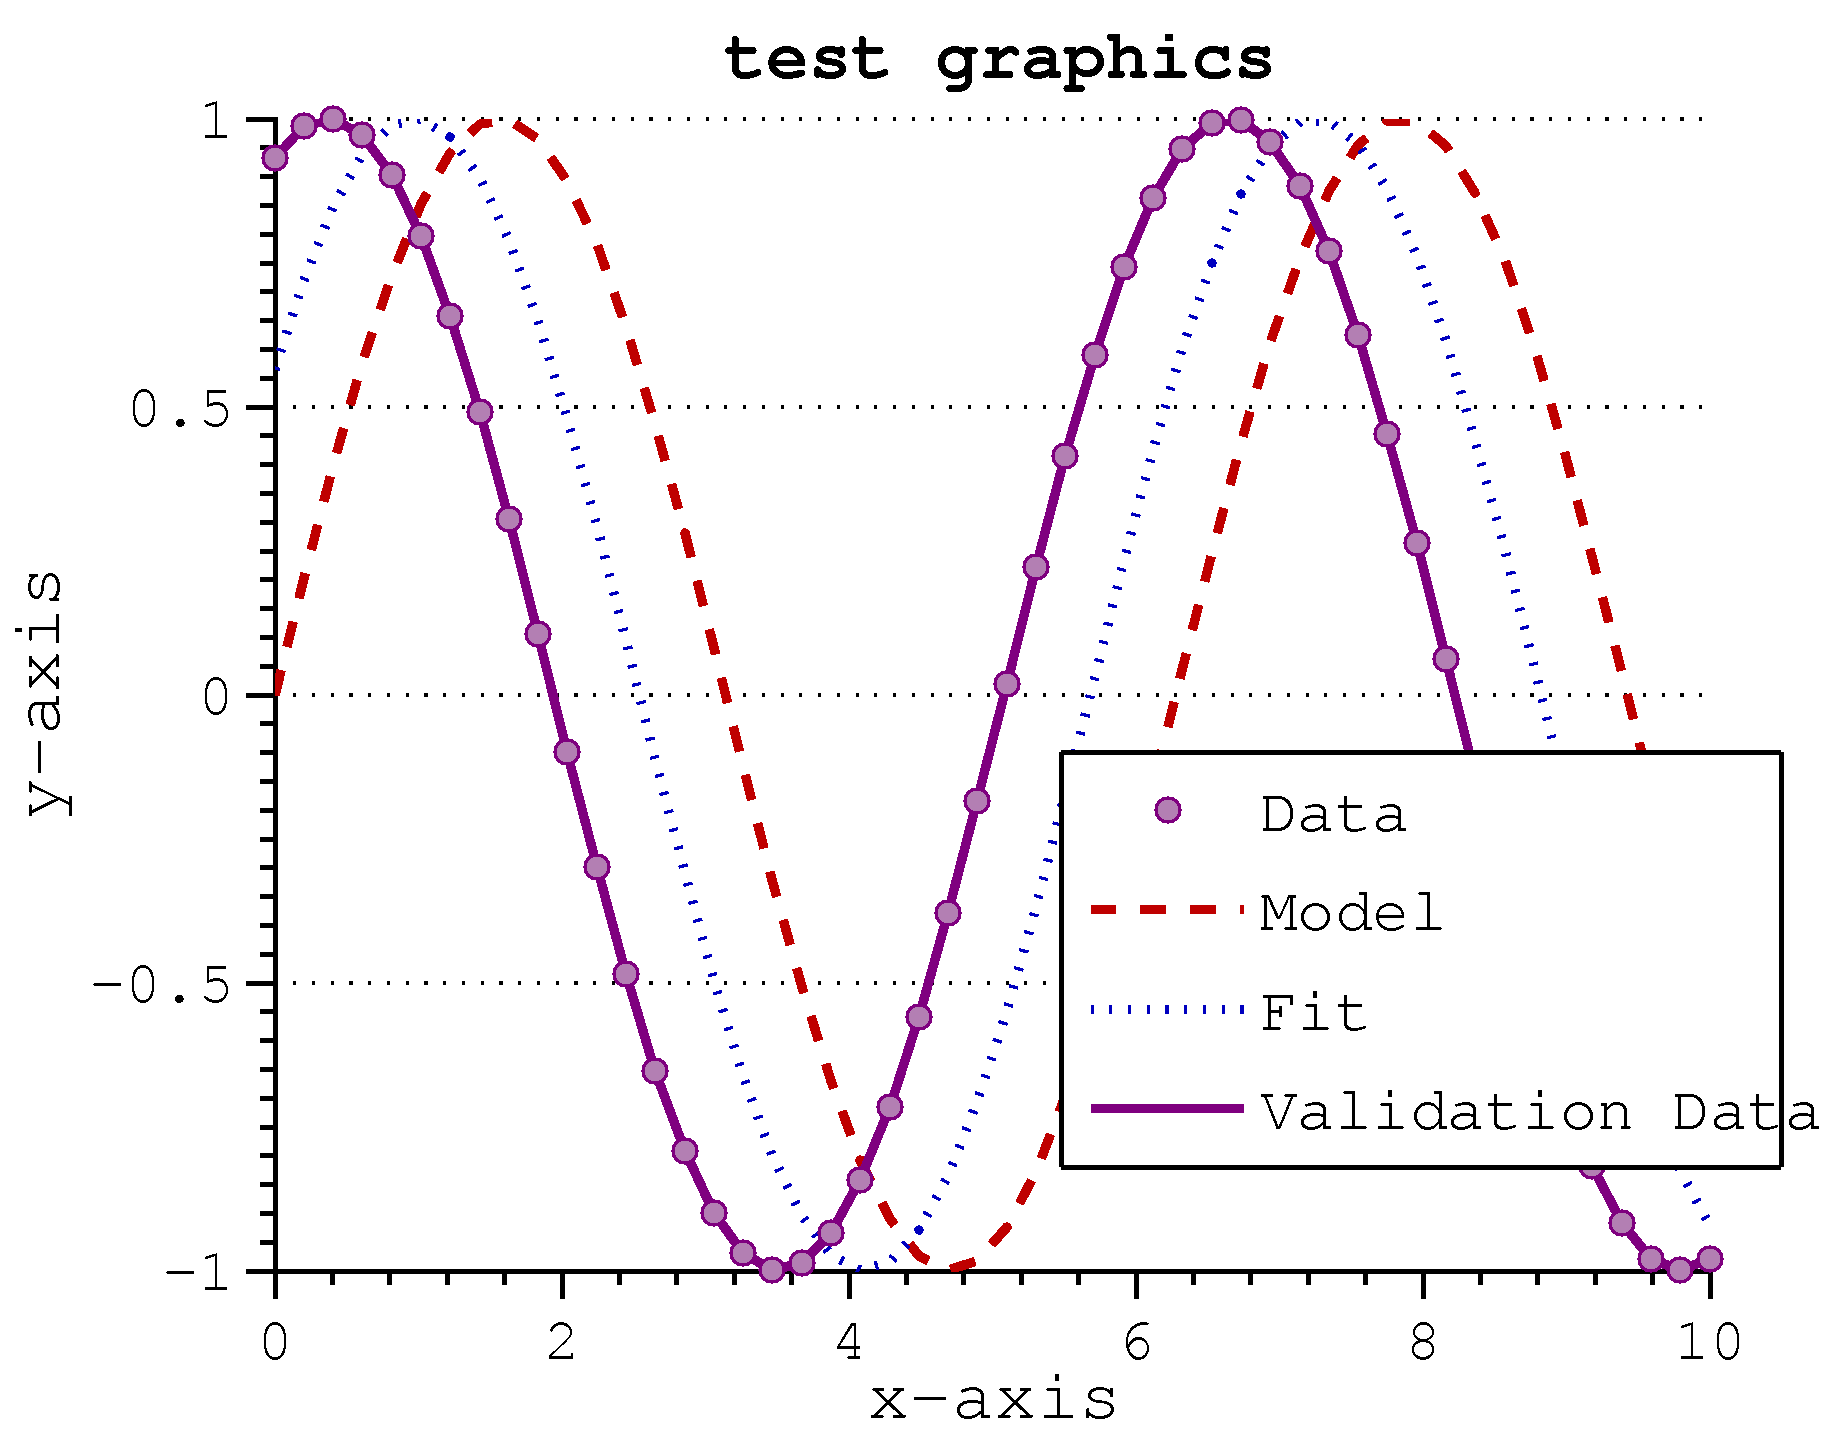
savefig
This is a matlab script which intends to provide cropped and clean pictures. This is done by exporting to eps and following conversion to the other formats by using Ghostscript.
png export
This script suffers from the eps font bug as well. There is thus not much difference to pure matlab:painters eps export.
export_fig
The tool collection export_fig with examples found here provides solutions for most matlab problems such as visual accuracy, resolution, the shrinking dots & dashes bug, and many others. It uses Ghostscript and xpdf internally.
painters renderer
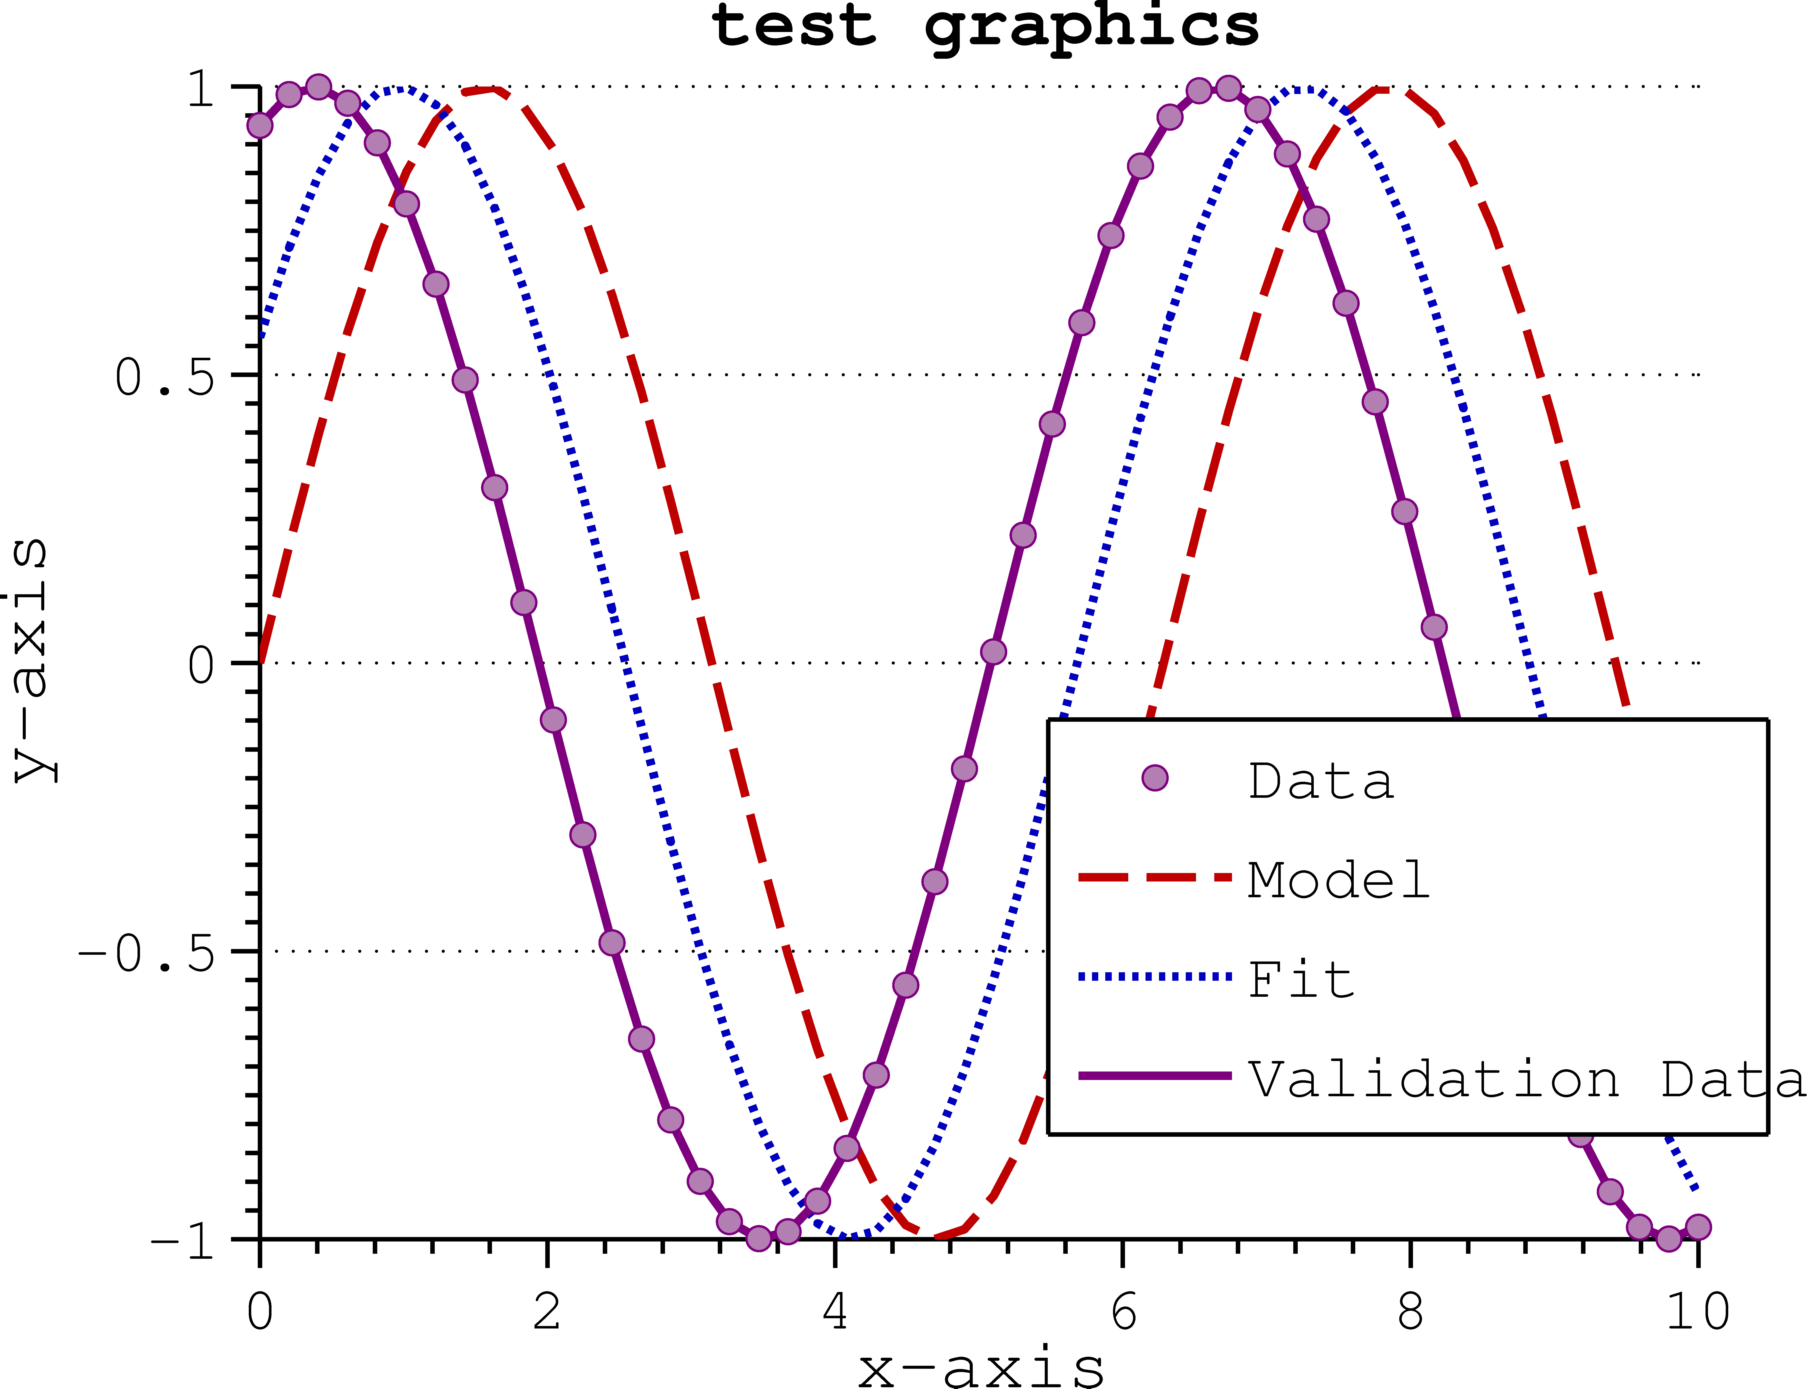
the linestyle quality is perfect. However since this script relies on eps export it includes the font problem
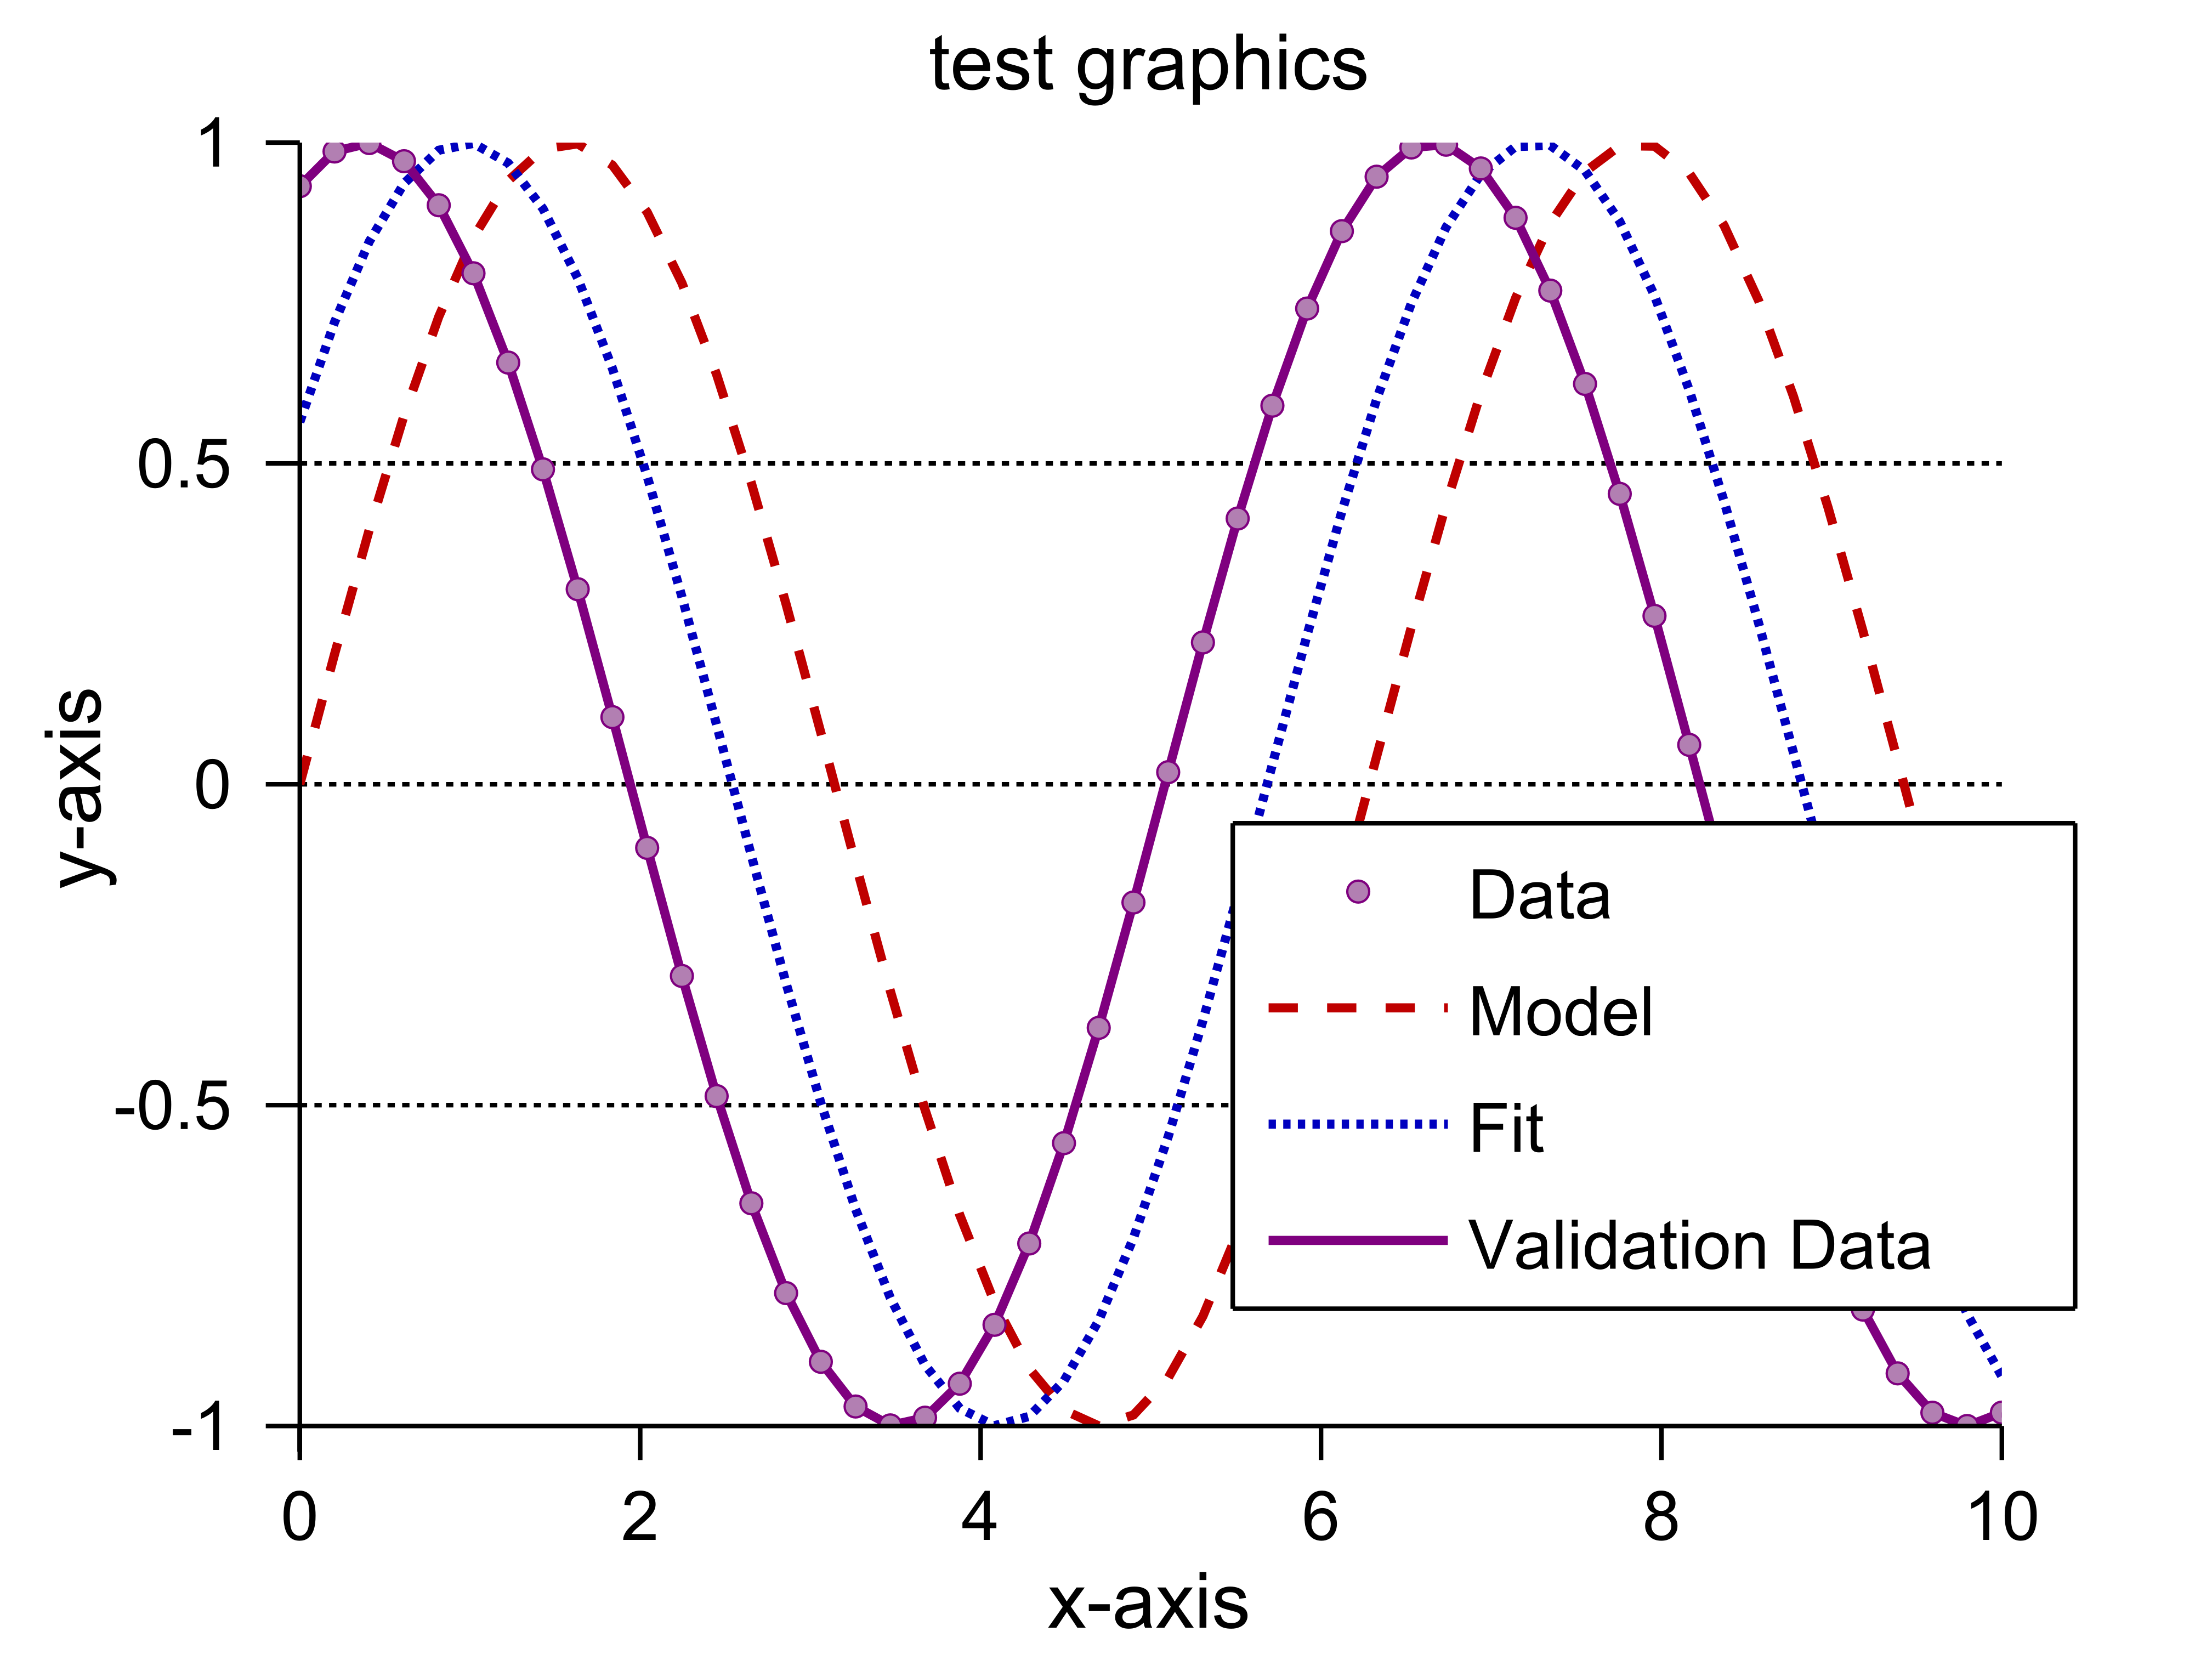
opengl renderer

Here the font is correct, as already with matlab standard opengl export. But it demonstrates cleary the shrinking dots & dashes bug!
plot2svg
The tool plot2svg tries to solve all the problem described so far by exporting to svg. From here png, eps and pdf conversion is possible without any loss or change of quality
This picture was created by exporting to png with 600dpi resolution. It shows that fonts and linestyles are perfect. However the whole plot is cropped at the upper boundary, which clearyl is a bug of this approach or this script.
latexfigure
This is my own approach to this problem. It uses matlabfrag to get around the eps font problem. The linestyles are corrected using the ‘fix_lines.m’ script from export_fig. However this requires a complete LaTeX collection and converts the resulting pdf afterwards in the target format. This script was inspired by mlf2pdf and I had to patch matlabfrag to support also non math fonts.
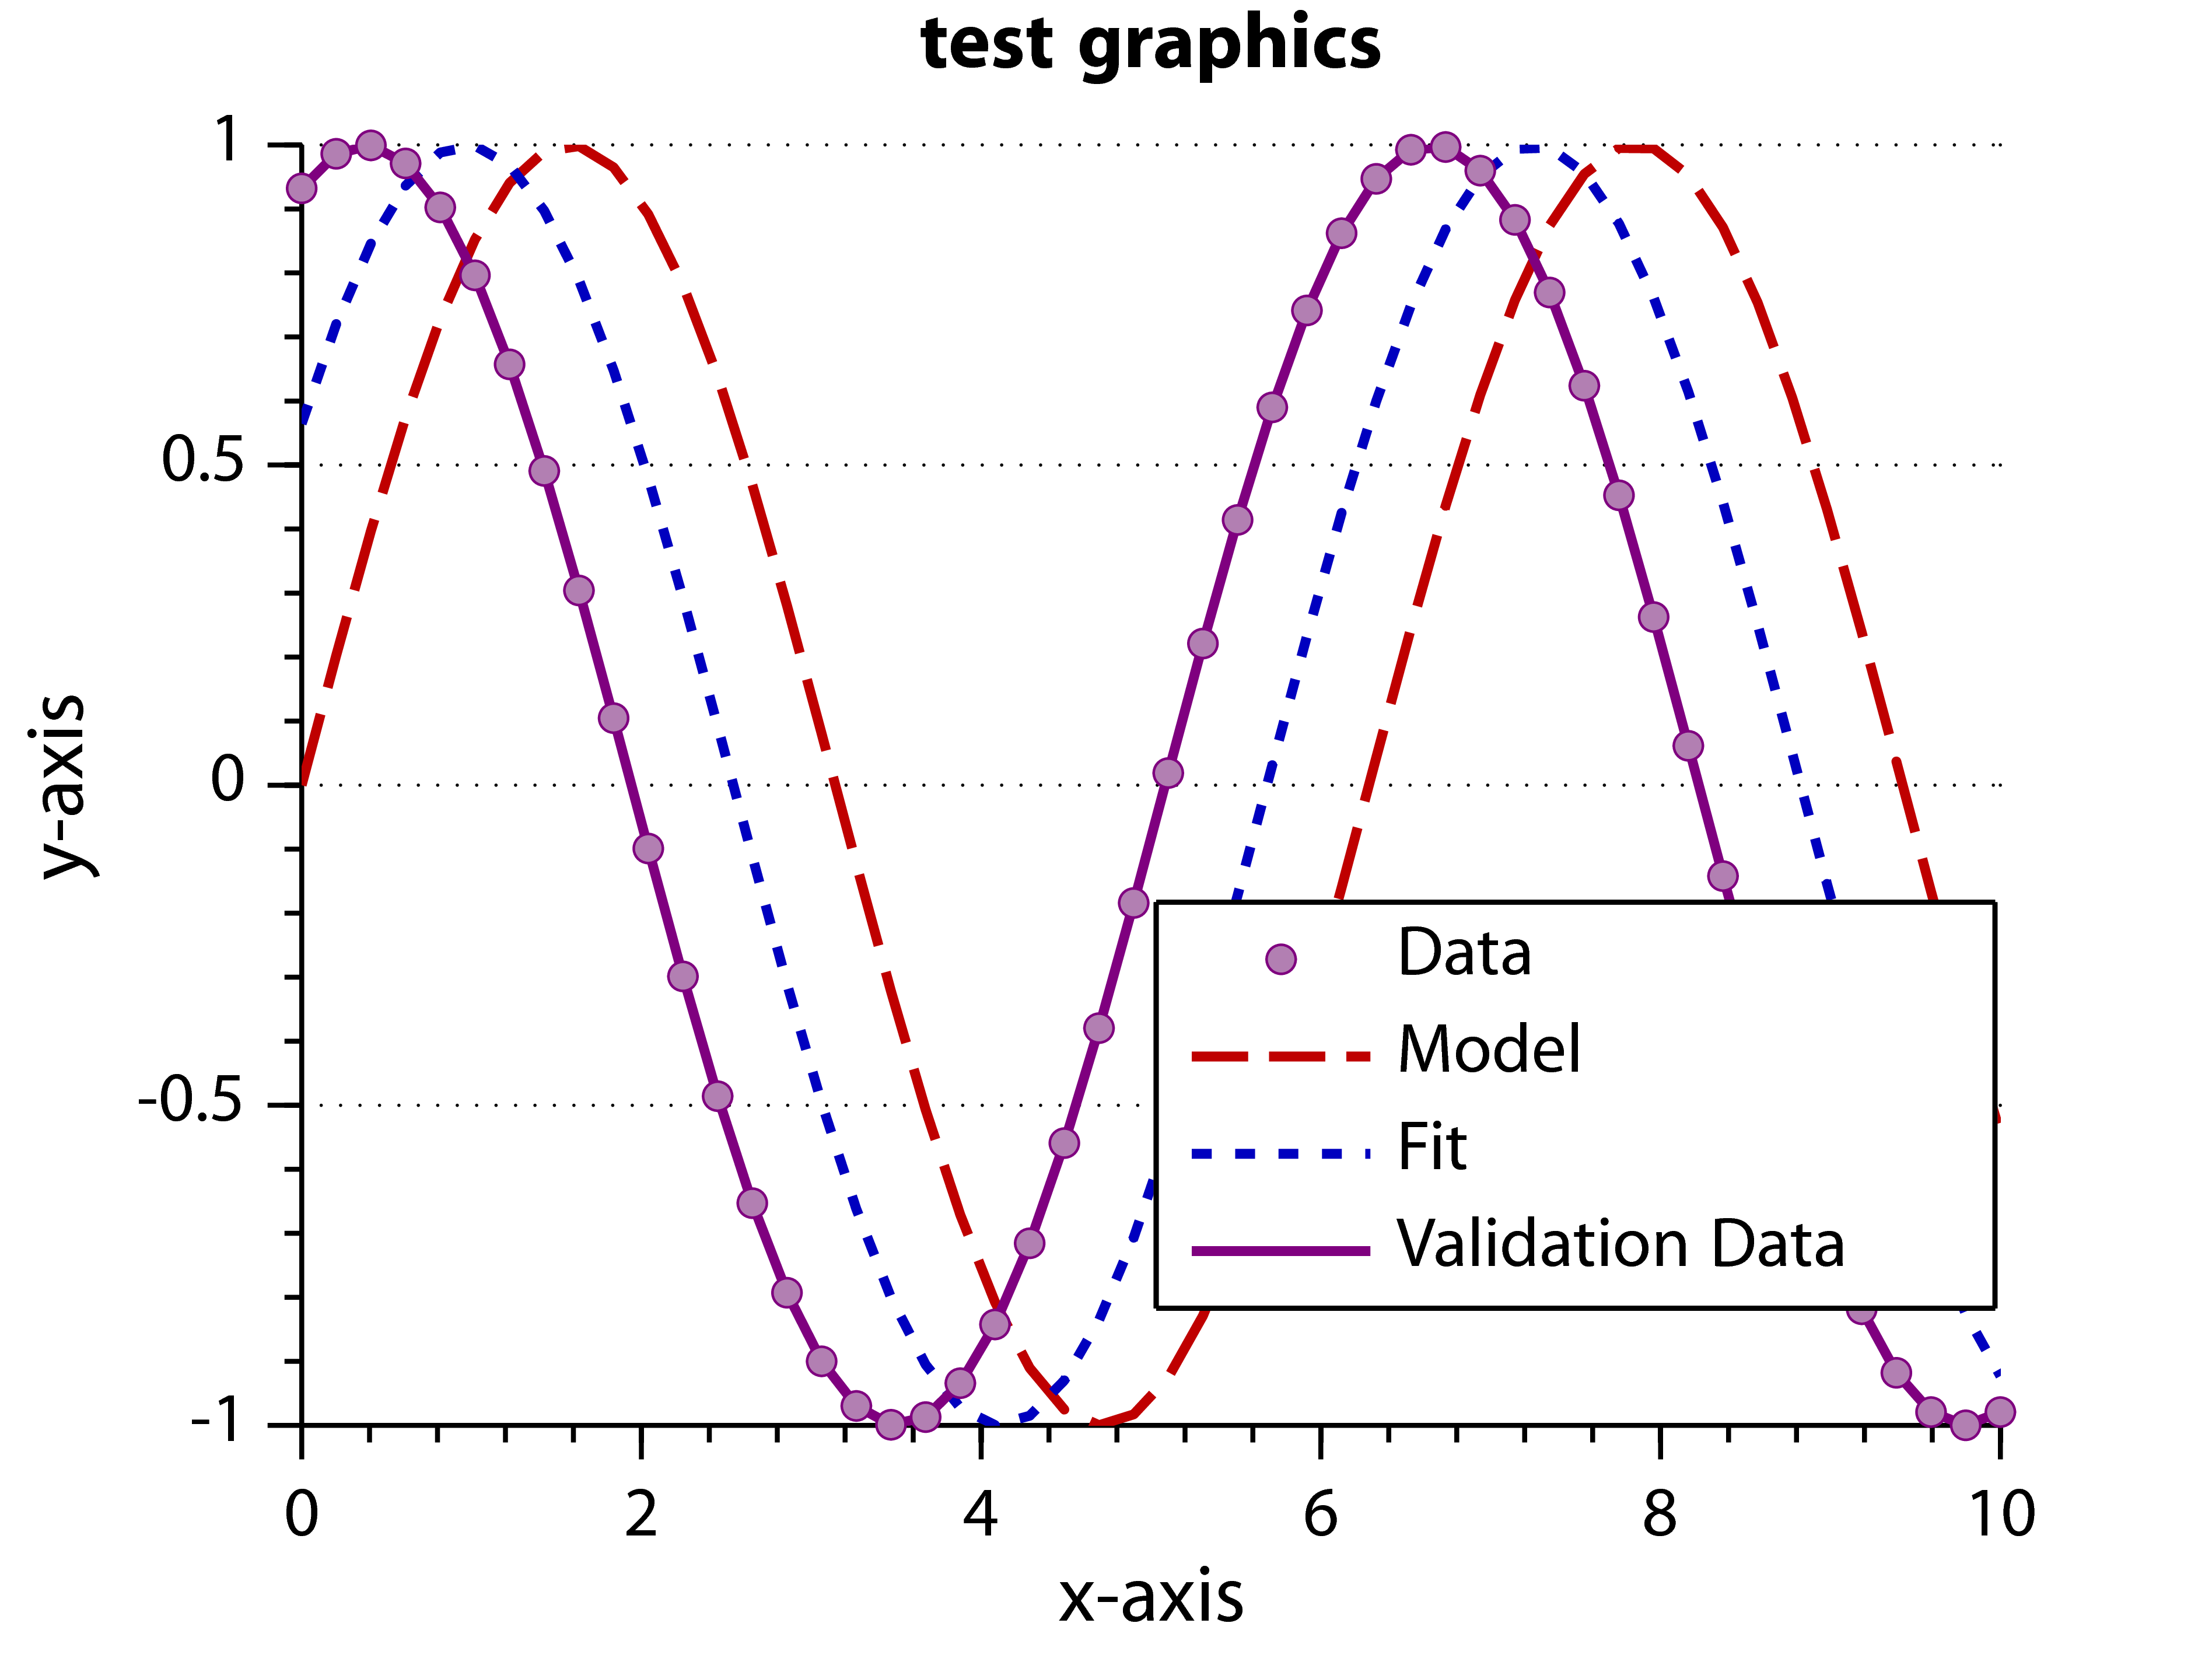
Here linestyles and fonts are correct. Only the title is in bold which was introduced by matlabfrag.
I wonder if any of those figure exporting methods help to unify the eps-files again?
Please could you try with following test data:
Z=peaks(100);
contourf(Z/max(abs(Z(:))),10)
caxis([-1 1]); colormap(jet)
and see the results whether the vector images look fragmented.
The tool
gswin32c.exeis either not installed or not within the windows path.Open a cmd window and try to execute the programm. You should see something like this
C:\Users\Matthias Pospiech>gswin32c.exe

GPL Ghostscript 9.07 (2013-02-14)

Copyright (C) 2012 Artifex Software, Inc.  All rights reserved.

This software comes with NO WARRANTY: see the file PUBLIC for details.
I’d really like to use your promising tool.
But somehow I always get the following error:
Der Befehl “gswin32c.exe” ist entweder falsch geschrieben oder
konnte nicht gefunden werden.
cmd =
gswin32c.exe -q -dSAFER -dNOPAUSE -dBATCH -dEPSCrop -dUseFlateCompression=true -dAutoRotatePages=/None -dHaveTrueTypes -r600 -dGraphicsAlphaBits#4 -dTextAlphaBits#4 -sDEVICE=png16m -sOutputFile=”C:\Users\Stefan Flau\Desktop\Promotion\Matlab-Tools\LaTeX_Figure\example\TEMP1576.png” -f “C:\Users\Stefan Flau\Desktop\Promotion\Matlab-Tools\LaTeX_Figure\example\TEMP1576.pdf”
Das System kann die angegebene Datei nicht finden.
What’s wrong here?
I do not have a solution for you, sorry. Note that if you want to have a wider audience you should ask matlab related questions on stackoverflow.com. The link to my plugin on matlabcentral is https://www.mathworks.de/matlabcentral/fileexchange/41894-latexfigure.
Hi there. I have used the script excessively and it has produced a lot of nice looking figures. But is there a way to narrow down the legend?
I define a size for the legend using a four element vector for the setting of the ‘location’ but MATLAB is widening the legend so that the entry for the legend fits. When I use for the example of a revolution speed
$n = 500/\textrm{min}$
I get a very wide legend with a big white edge after latexfigure converts the term to n = 500/min.
Thanks, I added my issue to the existing issue to the page. I am running into the problem using your latexfigure.m function. It’s not a problem using Palatino. It’s a general problem, that I only get the Charter font no matter which FontName I define.
You are not making it really clear what you are doing. If you are using the
printcommand of matlab you should ask your question on stackoverflow.com. If you are using my latexfigure script then I do not understand where the problem is. Note also that there is a special page for reporting issues (not questions): code.google.com/p/latexfigure/.Hi there, Jan again (from the third to last post). I ran into a little problem using Palatino for my figures. I tried setting the font name to ‘Palatino’ and ‘Palatino Linotype’ and MATLAB is setting the correct font in the figure but when I convert to eps or pdf the look is similar but not the same. This is very obvious when using the letter R, which is getting a little swing in the bottom right corner. I also checked the mathpazo font of LaTeX but that one has the same look as the Palatino Linotype of Windows although it is a slightly different clone of the original.
Is there a solution to this problem or a hint where to look at?
Hey! Nice Tool so far, I was looking for something like that since “normal” export via export_fig or print does mess up my unicode characters (I am working on Ubuntu Linux @ UTF-8).
For Latex matlabfrag is the best choice I think, but i need a vectorized graphic with the true annotations, not just labels.
But I realized the created fonts are no text anymore, is that correct? Is there no way back from the *.tex and the *.eps file with labels to the initial eps file (with the “real” text)?
Btw: For UTF-8 System you have to change line 165 to fprintf(fid,’\\usepackage[utf8]{inputenc}\n’);
Thank you!
Best regards,
Jan
You should try to run ‘latex’ from a console. If that fails you should add it to your path. If you do not know how to do that ask it somewhere else.
If it fails even with a set up path you can specify a path with the option ‘distpath’.
Hello,
thanks for the tool. I’m trying to get around my font-problem using “Palatino Linotype” for my graphics. But I’m already running into problems using the example in “plotTest.m”
Error using latexfigure/runLaTeX (line 204)
Error 1 — LATEX:
Das System kann den angegebenen Pfad nicht finden.
Error in latexfigure (line 101)
success = runLaTeX();
Error in plotTest (line 91)
latexfigure(hfig,’latexfigure’,’eps’,’packages’, latexPackages);
It seem’s that I need to define the path of my LaTeX-Distribution first. How do i do that?
Indeed, the gs converter has to be blamed – exporting the pdf via Adobe Acrobat Professional works perfectly. Thanks for your help!
The resulting pdf is generated by LaTeX. Therefore you should find out if you really load a vector (type 1) font. The eps is generated from the pdf file using ghostscript. Please check if you also experience this problem with pdf output. If not I would blame the gs converter.
That is a really nice tool and it helped me to get around the “FontName”-Bug in Matlab. Thanks a lot!
I do have one problem: After using latexfigure, my eps-file looks fine, but when I zoom in, the font is looking like a bitmap and not smooth like a vector. I tried several fonts, eg Cambria (my favourite one), a latex-font within the package kpfonts and a matlab-font Palatino. All fonts look like a bitmap.
What should I change?
Thank you in advance and best regards,
Andreas Hielscher
Thanks for the great code!
I do have a problem when trying to plot over very small or large ranges (i.e. 1E-07, 1E07..). It seems that Ghostscript can’t handle that form of notation? I’m running Matlab on OSX (Snow Leopard).
Thanks a lot
The code for
latexfigureis now online available from http://code.google.com/p/latexfigure/.If you experience problems or have code or ideas for further improments post here or me directly.
Currently I have not the time for this code (I am partly still working on it). But I promise to publish it within the next month…
In the meantime you can still use the matlabfrag package which is what I use internally.
The output of latexfigure looks great! I’ve wanted to find a good solution to separating text and graphics for some time, and this looks like it. I would love to see it on the Matlab Central File Exchange, or else be able to download the latest version from somewhere.