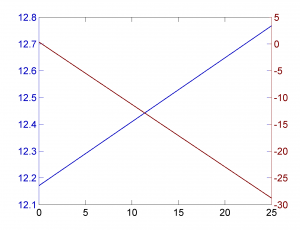
In matlab the normal way to create plots with two y-axis is to use the command plotyy.
This works quite simple, and creates equal tick locations for both data sets:
xaxis = 0:0.1:25; y1 = linspace(12.1712,12.7679, length(xaxis)); y2 = linspace(0.3597,-28.7745, length(xaxis)); [AX,H1,H2] = plotyy(xaxis, y1, xaxis, y2); plotstyle; % sets only colors, linestyle and fonts |

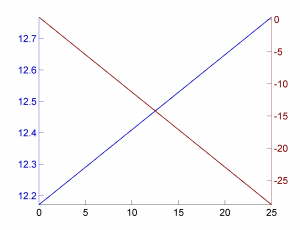
However for tick that are not equal on both sides the plot looks simply wrong.
[AX,H1,H2] = plotyy(xaxis, y1, xaxis, y2); % axis limits - x axis (min to max) set(AX, 'XLim', [min(xaxis) max(xaxis)]); set(AX(2),'XTick',[]); % y1 axis limits set(AX(1), 'YLim', [min(y1) max(y1)]); % y2 axis limits set(AX(2), 'YLim', [min(y2) max(y2)]); plotstyle; |

Unfortunately the web is full of question on how to remove the ticks on the opposite side. But Matlab completely fails at this point. It is simply not supported properly.
The only solution I could find/retrieve in a forum was the following one, which is based on the idea to remove the box property which paints the ticks on the opposite side. But it also removes the surrounding box, which is unwanted.
set(AX(1),'Box','off') % Turn off box of axis 1, which removes its right-hand ticks set(AX(2),'Box','off') % Turn off box of axis 2, which removes its left-hand ticks |

Another idea I found in this thread is to work with dummy axes, but I do not see how to integrate it with my plot function (the plot is empy after I execute this code)
% dummy axes for the box and background color ax0 = axes; set (ax0, 'Box', 'on', 'Color', 'white', 'XTick', [], 'YTick', []); % first axes for left y-axis ax1 = axes ('Position', get (ax0, 'Position')); set (ax1, 'Box', 'off', 'Color', 'none', 'YAxisLocation', 'left'); % second axes for right y-axis assuming common x-axis controlled by ax1 ax2 = axes ('Position', get (ax0, 'Position')); set (ax2, 'Box', 'off', 'Color', 'none', 'XTick', [], 'YAxisLocation', 'right'); |
Any hints or other solutions are welcome. please use this thread on stackoverflow.com for adding answers on your own.

Hi Pospiech,
I’m sorry for the late answer 🙂
Here’s some code, that implements my approach:
function plotyy_alternative
xaxis = -25:0.1:25;
y1 = exp(-(xaxis*2-1).^2)*5;
y2 = exp(-(xaxis/2+1).^2)/5;
hf1=figure;
%% curve1
ha1=axes(‘Parent’,hf1);
hp1=plot(ha1, xaxis,y1,’Color’,’r’);
% plot() resets ‘Box’ to ‘on’, so it is more convenient to set it here
ha1.Box = ‘off’;
% Setting ‘ActivePositionProperty’ to ‘Position’ may seem redundant in some
% cases, but, from my experience – it allows to avoid some possible issues,
% e.g. associated with window re-sizing and long labels.
%
ha1.ActivePositionProperty = ‘position’;
%% curve2
ha2=axes(…
‘Parent’,hf1,…
‘Position’,ha1.Position,…
‘ActivePositionProperty’,’position’,…
‘YAxisLocation’,’right’,…
‘XAxisLocation’,’top’,…
‘XLim’,ha1.XLim…
);
hp2=plot(ha2, xaxis, y2,’Color’,’b’);
% All these props are re-set by plot(), so it is more convenient to set it
% here
set(ha2,…
‘Box’, ‘off’,…
‘YAxisLocation’, ‘right’,…
‘Color’,’none’,…
‘XTick’,[],…
‘XAxisLocation’,’top’…
);
ha1.YColor=[0.8 0 0];
ha2.YColor=[0 0 0.8];
%% zooming
% We have to fix y-scales of both axes. Otherwise they would be changed
% individually (e.g. during zooming into figure), which is typically
% undesirable. These two lines simply change ‘YLimMode’ to ‘manual’.
% Note, that
% >> ha1.YLimMode=’manual’
% may also change your current scale to somewhat different, in contrast to
% our approach (and, moreover, behaves different in script and
% statement-by-statement environment. (Might be a bug in R2015b)
ha1.YLim = ha1.YLim;
ha2.YLim = ha2.YLim;
% If we want to support manual zooming:
% 1) we may link x-axes with a built-in function
linkaxes([ha1, ha2],’x’);
% 2) we may create our own callback, that defines y-axes re-scaling
addlistener(ha2,’YLim’,’PostSet’,@(Meta,EventData) myRescaler(ha1,EventData))
function myRescaler(ha1,EventData)
ha1.YLim = EventData.AffectedObject.YLim * 25;
end
end
Could you provide a complete minimal working example. I would like to add it if it works.
If anyone is still looking for a solution to this –
I’ve just combined the solution described above with moving X-axis of ax2 to the top, and removing it’s ticks (to create a “box”).
This seem to work, at least in R2015a.